
Guillaume Dumas
MEng, MSc, PhD, HDR
The meaning of significant mean group differences for biomarker discovery
Abstract
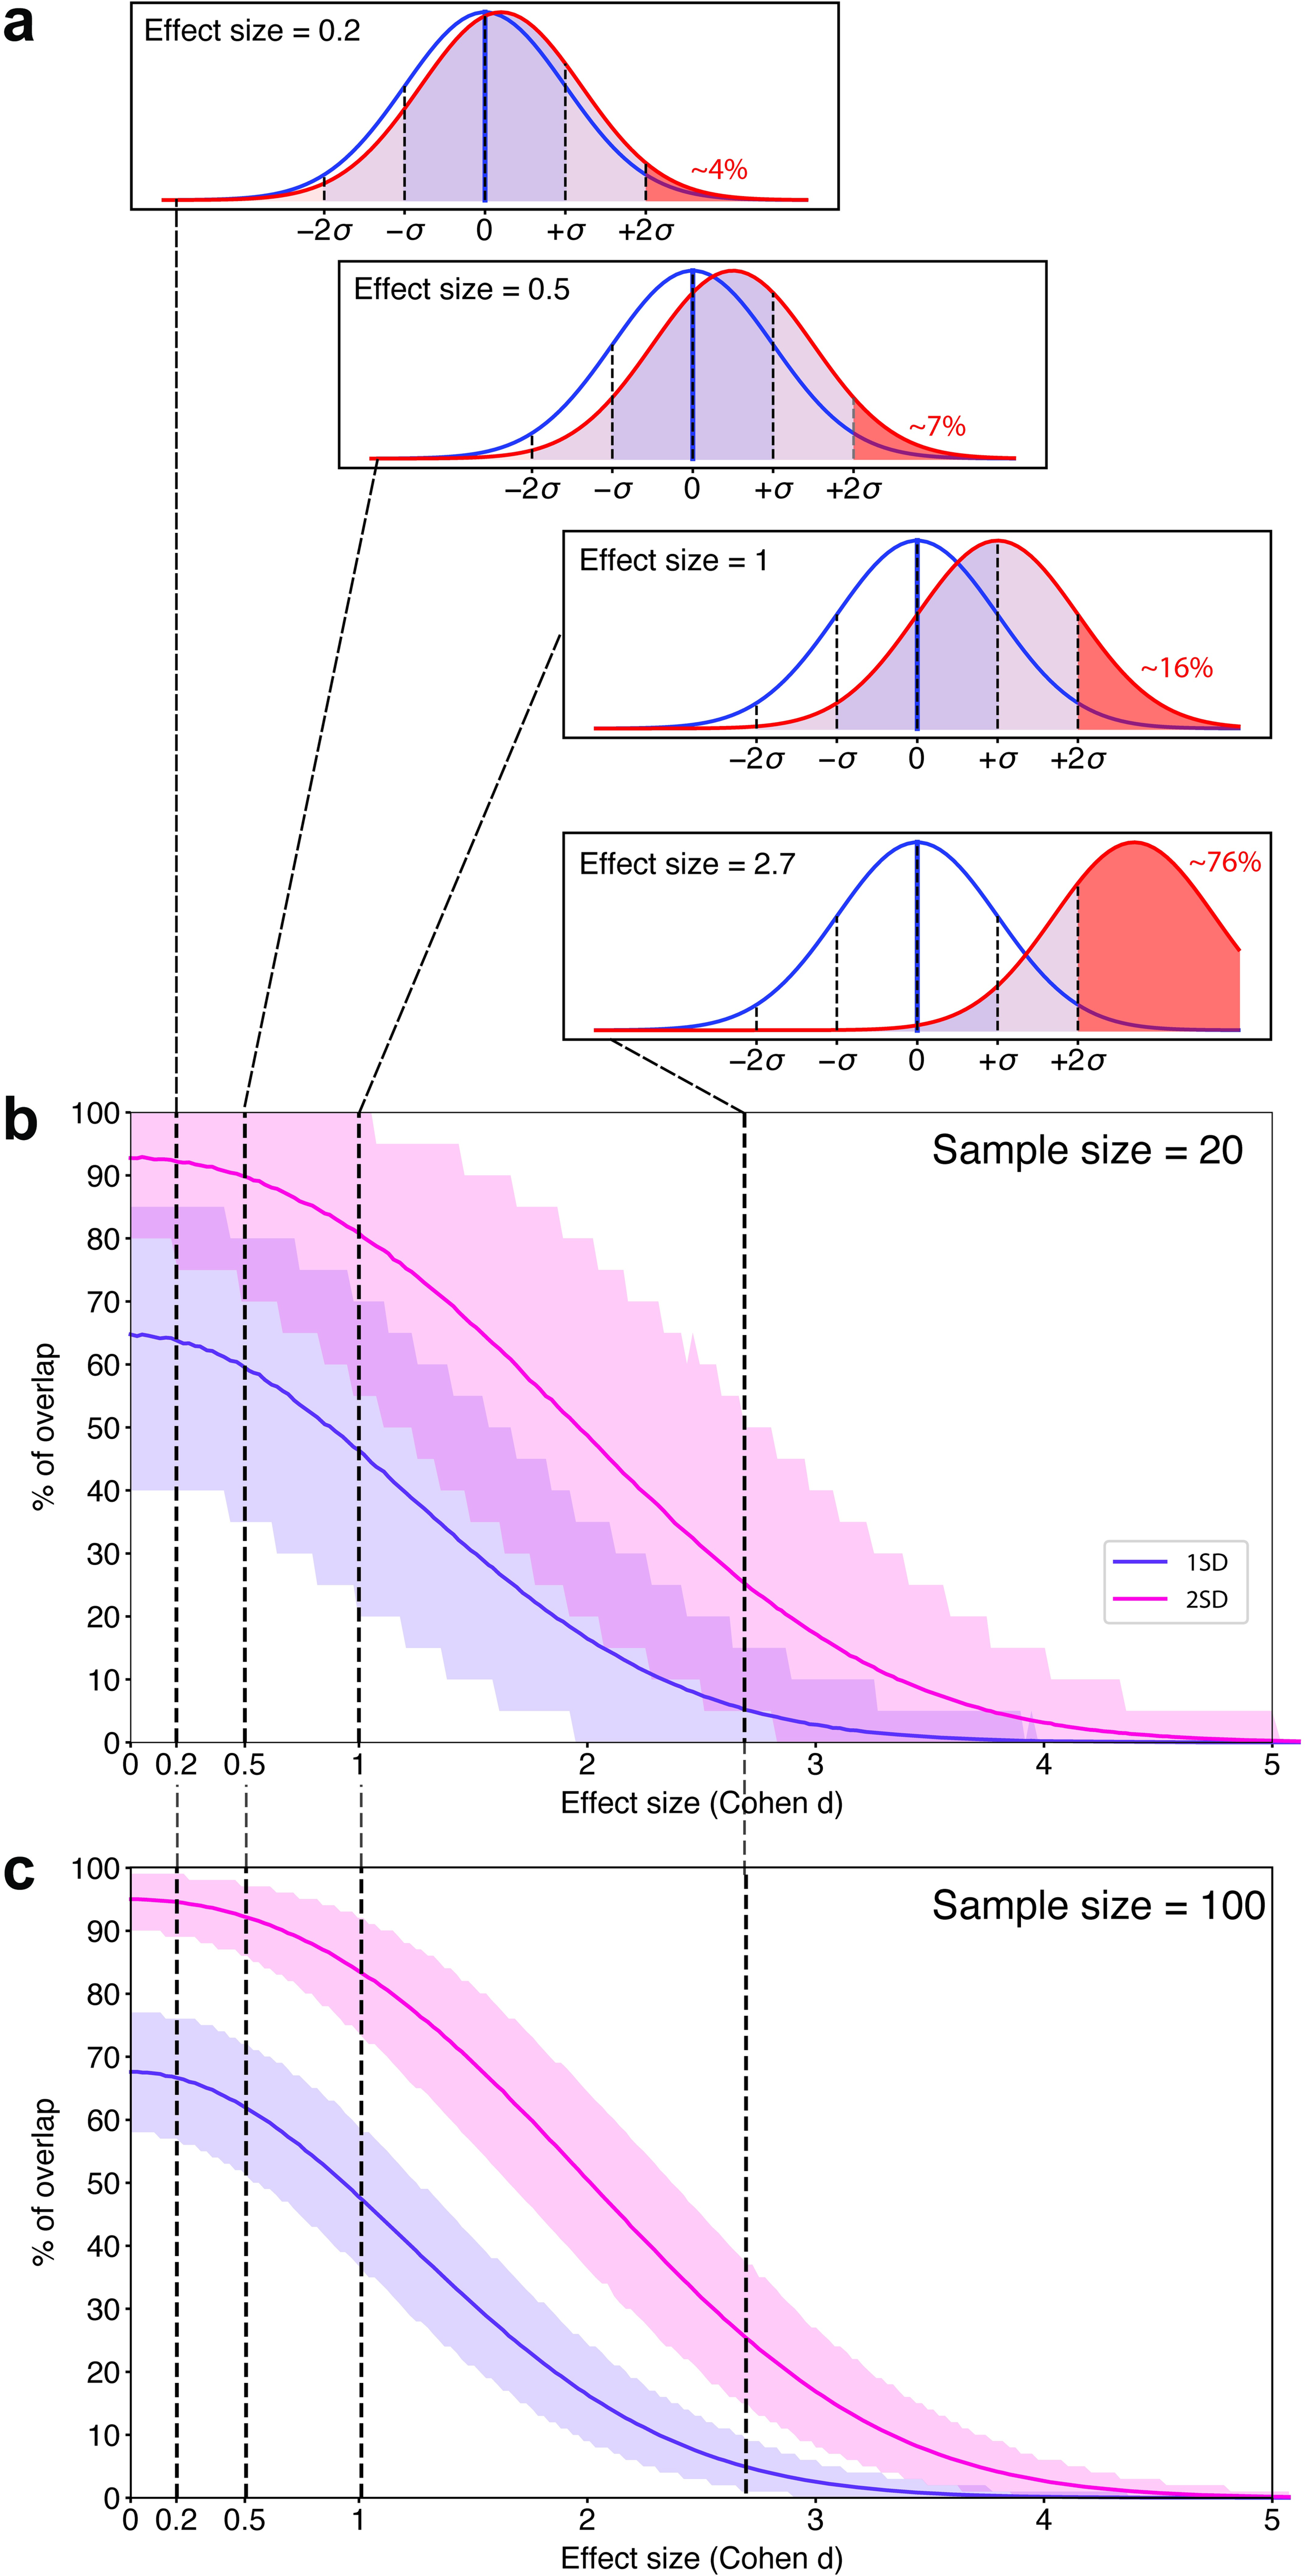
Over the past decade, biomarker discovery has become a key goal in psychiatry to aid in the more reliable diagnosis and prognosis of heterogeneous psychiatric conditions and the development of tailored therapies. Nevertheless, the prevailing statistical approach is still the mean group comparison between “cases” and “controls,” which tends to ignore within-group variability. In this educational article, we used empirical data simulations to investigate how effect size, sample size, and the shape of distributions impact the interpretation of mean group differences for biomarker discovery. We then applied these statistical criteria to evaluate biomarker discovery in one area of psychiatric research—autism research. Across the most influential areas of autism research, effect size estimates ranged from small (d = 0.21, anatomical structure) to medium (d = 0.36 electrophysiology, d = 0.5, eye-tracking) to large (d = 1.1 theory of mind). We show that in normal distributions, this translates to approximately 45% to 63% of cases performing within 1 standard deviation (SD) of the typical range, i.e., they do not have a deficit/atypicality in a statistical sense. For a measure to have diagnostic utility as defined by 80% sensitivity and 80% specificity, Cohen’s d of 1.66 is required, with still 40% of cases falling within 1 SD. However, in both normal and nonnormal distributions, 1 (skewness) or 2 (platykurtic, bimodal) biologically plausible subgroups may exist despite small or even nonsignificant mean group differences. This conclusion drastically contrasts the way mean group differences are frequently reported. Over 95% of studies omitted the “on average” when summarising their findings in their abstracts (“autistic people have deficits in X”), which can be misleading as it implies that the group-level difference applies to all individuals in that group. We outline practical approaches and steps for researchers to explore mean group comparisons for the discovery of stratification biomarkers.
Author summary
Currently, a striking paradox is often found in neuropsychiatric research. On the one hand, most clinicians and researchers accept that many neuropsychiatric conditions involve tremendous individual variability. On the other hand, the prevailing statistical approach is still the mean group comparison between “cases” and “controls.” Statistically significant mean group differences tell us that a given characteristic in brain, behaviour, or genes is on average different between the 2 groups. Yet, they do not delineate variability within groups. Moreover, using autism research as an example, we show that in up to 95% of abstracts, when reporting or interpreting findings, researchers omit the “on average.” This can be misleading because it evokes the impression as though the group-level difference would generalise to all individuals with that condition. Here, we used simulations to show that the latter statement is only true at very large effect sizes. We demonstrate that across different areas of autism research, mean group differences with small to large effects indicate that approximately 45% to 68% [cases] do not have an atypicality on cognitive tests or brain structure. However, we also show that across normal and nonnormal distributions, subgroups may exist despite small or nonsignificant overall effects. We propose practical approaches and steps for researchers to use mean group comparisons as the starting point for the discovery of clinically relevant subgroups.
Keywords: Biomarkers, Autism, Normal distributions, Autism Spectrum Disorders, Theory of Mind
Leave a Reply